Up to now, the project hosted on github, has been updated with a JavaScript web application that can show the streams that were created in the first two posts (see above). This web application is not the purpose of this post, it's purpose is about the way I was able to combine streams and present the results in a Spray server.
Goal
So what we will see here is how Spark Streaming enables two streams to be combine when they are, somehow, containing data about the same topics.Then we'll see how it is possible to package to amount of data that is coming over the web using an aggregation method like a windowed summarization.
Since a data is only interesting when it can be consumed by yet another analytic tool, it's pretty helpful to set up a server that enables some access to them -- to be consume by an OLAP application for instance; rather than reflushing everything in HDFS.
For that, we'll use the Spray server that Spark helps us to create, and we'll add it routes that renders the aggregated value (RDD) as Json document to be sent over the wire.
Rollin' to the river
In the first blog, it was configured a DStream that carried on data for each tweet matching a list of stocks ; these data were associated with a sentiment score and packaged in a dedicated structure named TwitterData.
In the next blog, we created yet another DStream that was responsible to poll the Yahoo! finance API to fetch stock changes in real time, for that another structure was created: YahooData that contains information about the actual changes of a given stock.
With that in hand, we can easily figure out that both DStreams are continuously giving information about the same topic: a stock. That's why we can setup a parent trait that define only one thing, that is a stock.
Here are the structures and the related streams:
The asInstanceOf[Data] are required because DStream is not covariant (probably because it is mutable).
Thus, what we could do now it to merge both of them into a single one! I can't wait more, let's do it:
What? You feel a bit frustrated because it's so simple? Completely understood, I was astonished as well how easy we can combine streams of packets where the time was part of the problem without having to do anything...
Cool, so now we have access to a full river of data coming in real time for a bunch of given stocks, but in real life (and with even more streams) it can be problematic to keep track of everything, or redistribute the whole thing. Let's see what we could do.
Compaction (aggregation)
A common workaround of the problem mention above (the capacity one) is to compute aggregated value for a window of time that slides on the stream.
To give a simple example, if we have a stream of integers that arrive at a very high rate, what can be done is to compute several stats on them on a regular basis. That is to say, we can choose to compute the mean and standard deviation of the integers coming the last 30 seconds, and do that every 5s.
This would reduce the need to store only doubles every 5s, rather than, maybe thousands of doubles. Having overlapping sliding window being helpful when applying regression for instance (more component of the variance is kept).
So here, what we are going to do is to compute an aggregation value which an overall score for each stocks present in the stream.
This score will simply be the sum over the sentiment (as -1 or 1) for Twitter part, itself added to the sum of the Yahoo changes (converted to -1 or 1) -- I'm not a financial guy so I've chosen something easy and straightforward to compute... it's not related to the technologies. Let's see how we could achieve that using the Spark API for DStream.
Nah! Okay, I'll start by the trick
map(x => (x.stock, List(x))). Actually, this is rather convenient for what will follow, that is we created a pair composed of a key being the stock and a value being the singleton of the initial data. This singleton thing will become really helpful when a "reduce phase" will happen.
Exactly, an aggregation over a sliding window being a classical use case, the Spark API has already integrated it for (thankfully should I say). So that, we only have to call the reduceByKeyAndWindow method with the reduce function (List.appendAll) and the window's duration, 60 seconds. Note that the sliding time wasn't given, I've chosen to keep the original slicing time from the DStream creation, 5 seconds.
I have to warn something, nevertheless, this function is only available here because we had adapted to something that looks like a KVP, that's why we can reduce byKey as well.
Since the key is the stock, we now have the list of all Data for a 60 seconds window grouped by stock.
Now, recalling what was said earlier, we only want to keep track of a score, not every Data. For that, we mapped the values only to something smaller, the overall score and the number of tweets and yahoo information that participated to this score.
Tada! We're done if the Spark thing... yeah actually, for this post at least (next will come the cluster deployment... but that's for the future!).
True, we're now collecting real time information about a list of stock associated with a score and the sources participation.
However, they're remain in memory... that's not really helpful right? Actually, once would request these data to perform their own analysis on them, so we need to open them to the outside world.
Delivering
Mmmmh, this part is a bit tricky because looking at the DStream API you don't have that much choice for that. We can persist (to memory, ...), we can save to an object file or a text file, but redistribute these persisted data would be costy for me, and I'm lazy.
But I like to read code, so I read the Spark code again, I felt again on the AkkaUtils class used in my previous post to create the actor system. And, in fact, this helper is able to create a Spray server as well -- you know this super power server thing that is able to deliver resources at an insane rate thanks to Akka!? If no, open this link in a new tab and read it afterwards (or now), you'll love it!
Given that, I thought to my self that it'd open some door to laziness, which I liked a lot.
The idea is to start such Spray server that would deliver an actor holding a representation of the aggregated information grouped by stock, with the value being the list of these aggregated data.
WARN: This is certainly not the most efficient way to do this because the state of the actor grows monotonically, but it sufficient for now.
To do so, I've reused the trick from the previous post, to create a class in the spark package that starts the Spray server using AkkaUtils. Afterwards, the route are declared to render the data accumulated in the following actor:
This actor will be simply populated by the DStream itself using the transform function:
I wanted to show it to you because of the FIXME, which is still not fixed. Actually, the function that is given to transform will be part of the lineage of the RDDs, so it has to be serializable. And if I simply reuse an actor as a closure, Akka will tell me (actually how Spray uses the Akka serialization) that it's not possible to make the actor serializable since it doesn't have any actor system in the context... (when Spray calls the serialization).
To counter that, I took the hard way, which is simply "recreating" actor system and actor within each RDD's transform call! And it's very bad. Sorry about that...
If you want more information about this service, just check out this little class here, we're you'll find the JSON serialization as well for the "REST" operations.
HTMLization
Since reading JSON on the fly is not my passion neither part of my resume (which should be somewhere there! or maybe there? Arf, I dunno, anyway...), I've created a very lightweight and not really user friendly interface that shows the results in real-time.
It's all located in the web folder and is intensively using Bootstrap from Twitter, AngularJs from Google and D3.js from Mike.
To start it, you'll need to start the whole thing as described in the README, afterwards you'll be show this kind of stuffs:
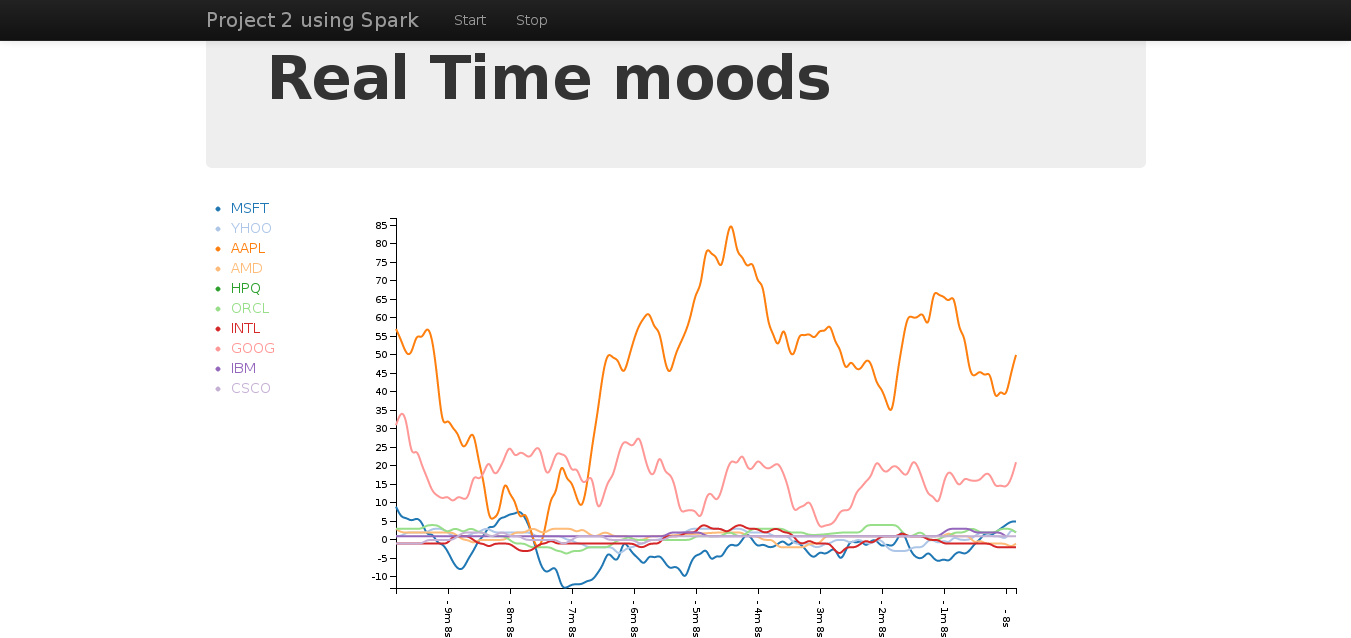 |
| My fairly UI |
What should come next...
... When I'll have some time.
The next logical step, for me at least, from here is now to deploy everything on a cluster. Because, for now, back in the first post, the context was created locally, so everything to going fine... maybe due to this fact.
So that'll be the next thing in this series, deploy on Amazon or on a local Vagrantized cluster of VMs ^^.
If any is likely to help, give me pointer or make any comments, Please do!
Hope you like the read, if only someone reached this point without getting bored. If you do, a small tweet to poke me would be awesome (@noootsab).
No comments:
Post a Comment